
We are pleased to share our comprehensive Ann Arbor fall market update for the Ann Arbor MLS Market through September 2020. The residential real estate market has been an economic leader in 2020 and should continue to perform well going into 2021. It is important to note that market conditions vary greatly by neighborhood, the condition of the property being sold, and the pricing and marketing of the home. Please reach out to us if you would like to know more about selling or buying a home in today’s market.
Sellers have experienced a stellar market this year and buyers have been experiencing a continued tough time finding properties. Though, we have found that even with a greatly reduced inventory, we have been able to find great homes and value for our buyers.
Sellers have been reluctant to list their homes during the COVID 19 pandemic. Those that are listing are very motivated to sell and have been rewarded with short times on the market and record-high sales prices.
Buyers that are focused on buying have been able to find great properties, and take advantage of record-low interest rates and motivated sellers. We feel that the real estate market is functioning well now for both sellers and buyers and there is no reason to wait – if this is the right time for your household to buy or sell a home.
We never suggest buying based on the market but rather based on your needs after a thorough consultation to understand your motivation to buy or sell and your needs. If you would like to schedule an in-person, Zoom, or phone consultation Please reach out to us.
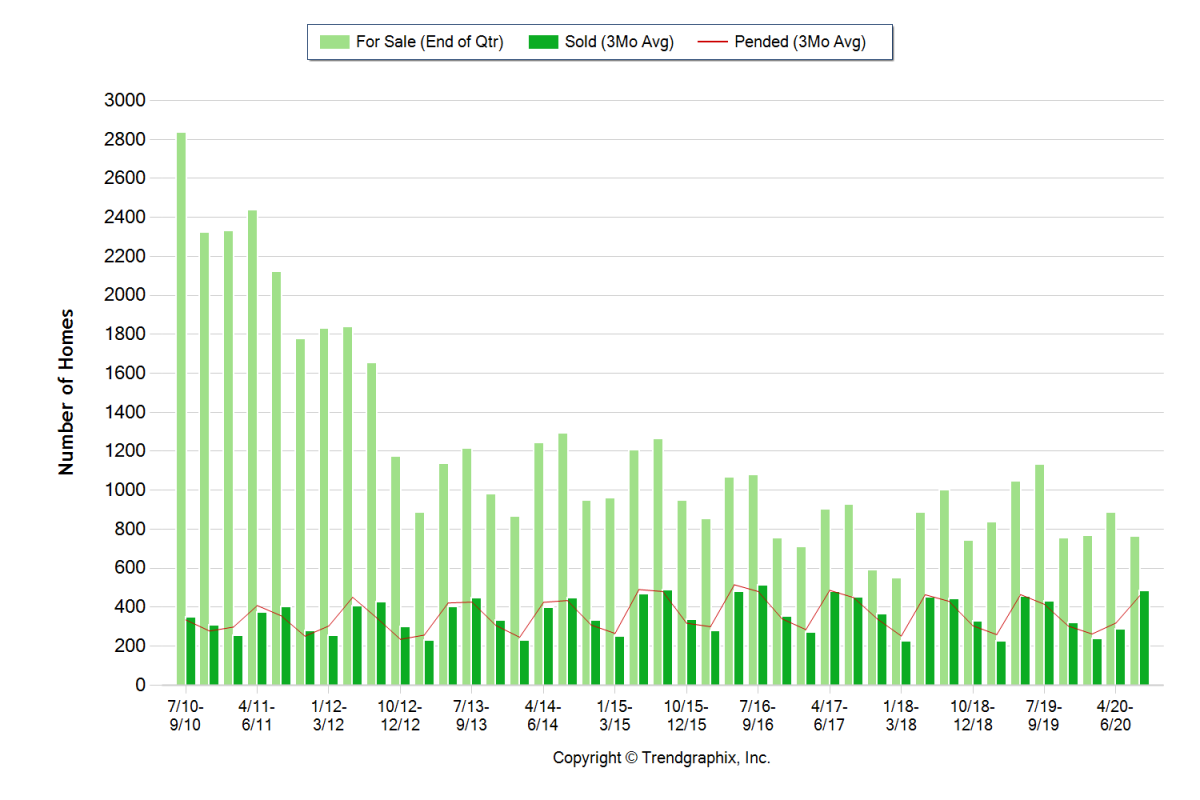
September 2020 (Quarterly) is a Seller’s Market!
- The number of for-sale listings was down 32.8% from one year earlier and down 14.2% from the previous quarter.
- The number of sold listings increased 12.6% year over year and increased 70% quarter over quarter.
- The number of under contract listings was up 44% compared to the previous quarter and up 10.8% compared to the previous year.
- The Months of Inventory based on Closed Sales is 1.6, down 38% from the previous year.
- The Average Sold Price per Square Footage was up 2.7% compared to the previous quarter and up 4.4% compared to last year.
- The Median Sold Price decreased by 1.7% from last quarter.
- The Average Sold Price also increased by 1.8% from last quarter.
- Based on the 6 quarter trend, the Average Sold Price trend is “Appreciating” and the Median Sold Price trend is “Neutral”.The Average
- Days on Market showed a neutral trend, an increase of 3.2% compared to the previous year.
- The ratio of Sold Price vs. Original List Price is 97%, which was the same compared to the previous year.
September 2020 Property Sales (Sold)
- Sales – September property sales were 1455, up 12.6% from 1292 in September of 2019 and 70% higher than the 856 sales last quarter.
- Current Inventory (For Sale) versus last year, the total number of properties available this quarter is lower by 371 units of 32.8%. This year’s smaller inventory means that buyers who waited to buy may have a smaller selection to choose from. The number of current inventory is down 14.2% compared to the previous quarter.
- Property Under Contract (Pended) There was an increase of 44% in the pended properties in September, with 1377 properties versus 956 last quarter. This quarter’s pended property sales were 10.8% higher than at this time last year.
The Average Sold Price per Square Footage is Appreciating
The September 2020 (Quarterly) Average Sold Price per Square Footage of $189 was up 2.7% from $184 last quarter and up 4.4% from $181 in September of last year. The Average Sold Price per Square Footage is a great indicator of the direction of property values. Since Median Sold Price and Average Sold Price can be impacted by the ‘mix’ of high or low-end properties in the market, the Average Sold Price per Square Footage is a more normalized indicator of the direction of property values.
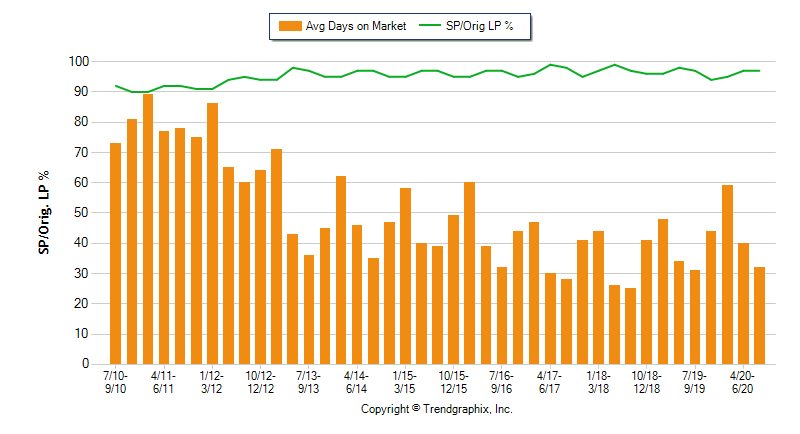
The Days on Market Shows Neutral Trend
The average Days on Market (DOM) shows how many days the average property is on the market before it sells. An upward trend in DOM tends to indicate a move towards more of a Buyer’s market, a downward trend indicates a move towards more of a Seller’s market. The DOM for September 2020 (Quarterly) was 32, down 20% from 40 days last quarter and up 3.2% from 31 days in September of last year.
The Sold/Original List Price Ratio Remains Steady. The Sold Price vs. Original List Price reveals the average amount that sellers are agreeing to come down from their original list price. The lower the ratio is below 100% the more of a Buyer’s market exists, a ratio at or above 100% indicates more of a Seller’s market. This quarter Sold Price vs. Original List Price of 97% is the same as last quarter and the same as in September of last year.
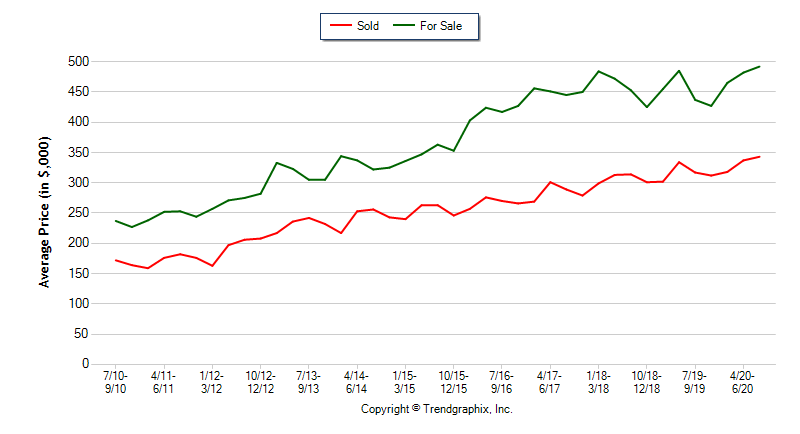
The Average Sold Price is Appreciating
- The Average Sold Price in September was $343,000, up 8.2% from $317,000 in September of 2019 and up 1.8% from $337,000 last quarter.
- The Median Sold Price is Neutral* The Median Sold Price in September was $295,000, up 6.5% from $277,000 in September of 2019, and down 1.7% from $300,000 last quarter.
The Bottom Line:
The bottom line is that inventory is tight, prices are steady and still rising, buyers are out in the market, interest rates are low, and fewer sellers are listing this fall than last.
The biggest trends are that more people bought homes this summer/fall than last which is a good sign in terms of predicting consumer confidence and the underlying health of the market. That being said, fewer properties are coming on the market this fall than last. This means that inventory is as tight if not tighter than was projected at the beginning of the year.
What will happen this winter and into next Spring remains to be seen since our economy largely hinges on factors that cannot be easily predicted ahead of time (i.e. potential Covid-19 surges this winter). What we do know is how the market looks now. Interest rates are low and buyers are out in the market. Our advice is, if you feel like now is the time to sell, don’t wait just to see how the market is this Spring.
If you have further questions on the market or would like to receive a tailored market update for your neighborhood or property, contact us!