
Written for the Urban Institute’s Housing Finance Policy Center by Mike Loftin in May 2021, this article provides useful and detailed information about the long-term financial benefits of homeownership and the long-term costs of renting. Though lengthy, we feel that it is a great resource for those considering buying in this market, and conversely, considering not buying simply because of higher prices.
While we always stress to clients that they must take a holistic approach that weighs multiple factors when deciding whether or not it is the right time to buy, sound financial advice says that homeownership is a strong and smart investment, especially in the long-term!
Click here to discuss homeownership with Andy.
Homeownership Is Affordable Housing
If you are reading this brief, you probably care about the nation’s housing affordability crisis and know something —maybe even a great deal—about today’s residential real estate market. You probably know that rents have increased dramatically since the Great Recession, outstripping inflation and especially burdening low-income households and people of color; that home prices are soaring; and that 75 percent of renters earning less than $50,000 a year spend more than 30 percent of their income on housing, and of those, 42 percent spend more than half their income on housing.
There is no shortage of policy proposals to address the housing problem. Some encourage the federal government to invest in building more public housing. Others suggest increasing subsidies to builders of affordable apartments, and still others recommend dramatically increasing the availability of rent vouchers that pay landlords a portion of the rent so that tenants can pay less. These measures fail to take into account America’s biggest source of affordable housing: homeownership!
America’s biggest source of affordable housing: homeownership.

Contrary to popular belief, owning one’s own home is frequently more affordable than renting. It is cheaper to buy a home than it is to rent in two-thirds of American counties.
We do need affordable rental housing. No one would argue that homeownership is the only solution to the housing crisis. But when it comes to ensuring long-term housing affordability, rental strategies can be short sighted. Many rental programs, such as rent vouchers, require an assistance check to be issued every month to a landlord who is under no obligation to renew a tenant’s lease. And there is no guarantee the federal government will continue to provide monthly rent support.
Plus, rent vouchers are expensive. More than $39 billion is paid to landlords every year to subsidize their tenants’ rent, well over half the US Department of Housing and Urban Development’s entire budget. A new administration can mean cutbacks, leaving renters vulnerable to paying more toward rent or receiving no assistance at all. When it comes to providing housing that is affordable and secure over the long term, rental programs can come up short.
Increasing Access To Affordable Homeownership
Affordable homeownership, on the other hand, provides the kind of affordability and stability low- income families need. The home gets more affordable over time, and the housing is more stable because there is no landlord to evict you. Increasing access to affordable homeownership can allow us to establish long-term solutions to the nation’s affordability crisis.
When my parents bought their first and only home in 1955, they had to turn to the seller to loan them the down payment, something that was, and still is, illegal. That illegal loan was a critical step in providing a stable financial future for our family, as it gave my parents access to an affordable mortgage.
Not much has changed since my parents bought their home. Today, little help is available to help first-time homebuyers, especially those whose parents and grandparents never bought a home and never accumulated enough wealth to help their own children—a population that is disproportionately people of color. If the nation is committed to helping all Americans enjoy the benefits affordable and stable housing, we need to do more to help low-income families and racial and ethnic minorities own their own housing. We can accomplish that goal by increasing the availability of affordable homeownership. But to do so, we must first understand why and how homeownership makes housing more affordable.
The Costs of Owning versus Renting
When we want to know how affordable housing is, we look at data that tells us the share of income a household pays for housing expenses. We can examine this housing expense ratio by tenure—whether the household rents or owns—and by the household’s income range, or race, or ethnicity. For example, a household with a monthly income of $2,000 that spends $1,000 on housing has a housing expense ratio of 50 percent.
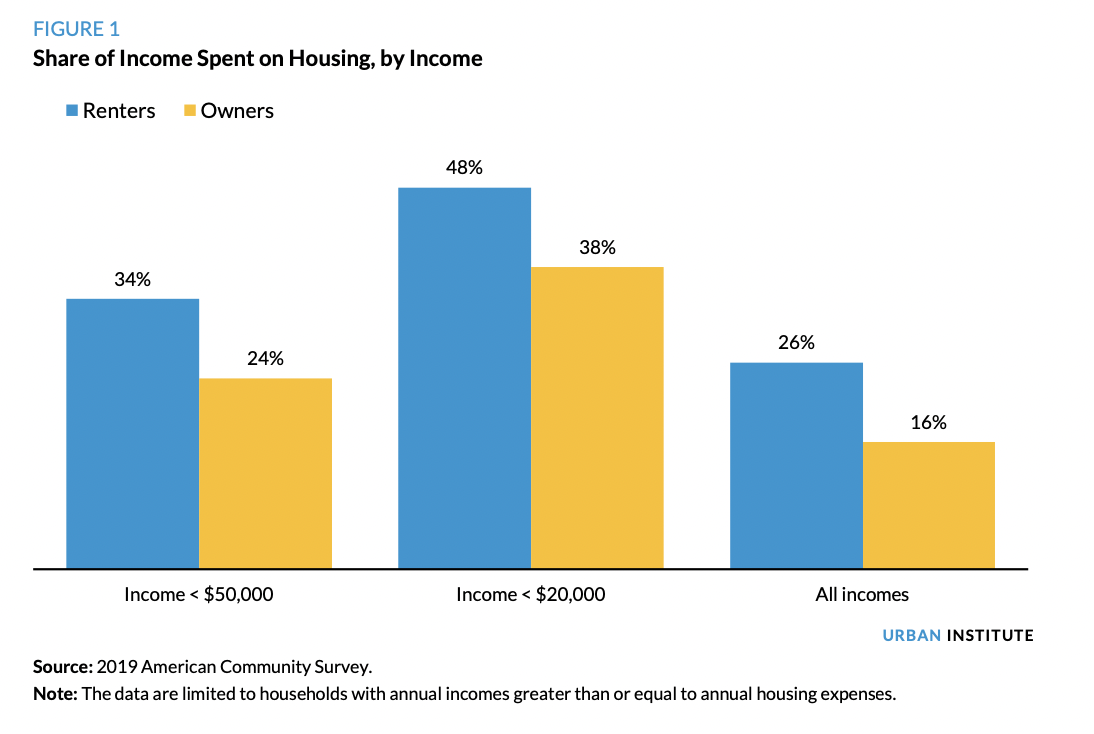
When we look at the median housing expense ratio of all households, the typical homeowner household spends 16 percent of its income on housing while the typical renter household spends 26 percent (figure 1). This is true, you might say, because people who own their own home must make more money than people who rent. But if we control for income, it is still more affordable to own a home than to rent housing, on average. For households with annual incomes less than $50,000, renters spend an average of 34 percent of their income on housing while owners spend only 24 percent, controlling for income. Similarly, for households earning less than $20,000, homeowners spend 38 percent of their income and renters spend 48 percent. Even among very low–income families, homeowners spend 10 percentage points less of their income on housing than renters.
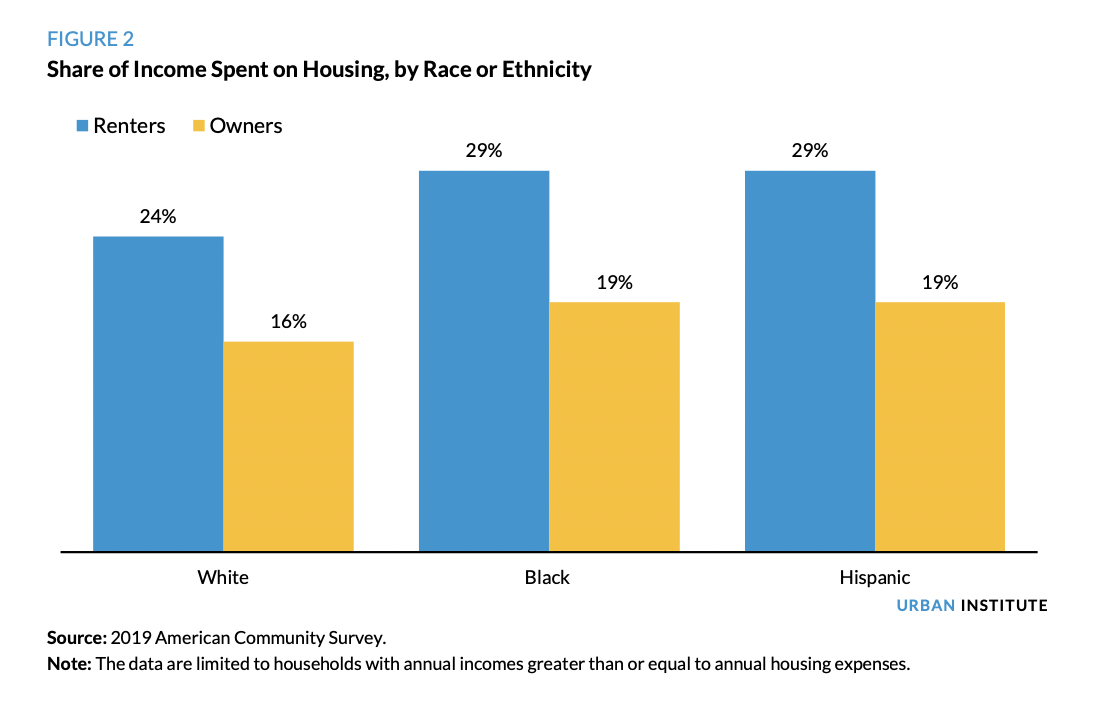
The lower cost of owning versus renting also holds true by race or ethnicity. Black and Hispanic homeowners have higher housing expense ratios than white homeowners, but they have lower housing expense ratios than all renters, regardless of race or ethnicity, including those who are white. Specifically, the median housing expense ratio for Black and Hispanic homeowners is 19 percent while the typical white renter household spends 24 percent of its income on housing. This is an amazing statistic given the systemic racism plaguing the American real estate and capital markets and one that we should weigh more heavily when considering strategies for equitably increasing access to affordable housing.
Who Is Considered Housing Cost Burdened?
Housing cost burden reflects whether housing costs are or are not burdensome—or overly burdensome—to a household. A household’s cost burden depends on its housing expense ratio. People who spend more than 30 percent of their income on housing are cost burdened, and those who spend more than 50 percent are severely cost burdened. The lower your income, the more likely you are to be cost burdened.
Cost burden helps us understand how much strain housing costs place on a household’s overall financial position. Households spending less than 30 percent of their income on rent has an affordable housing cost and is thus not burdened by the expense. In comparison, households spending at least 50 percent of their income on housing expenses are severely cost burdened because high housing costs leave little money to cover other basic necessities, such as food, transportation, clothing, and health care, leaving the household in a precarious financial situation and making it harder to achieve economic mobility.

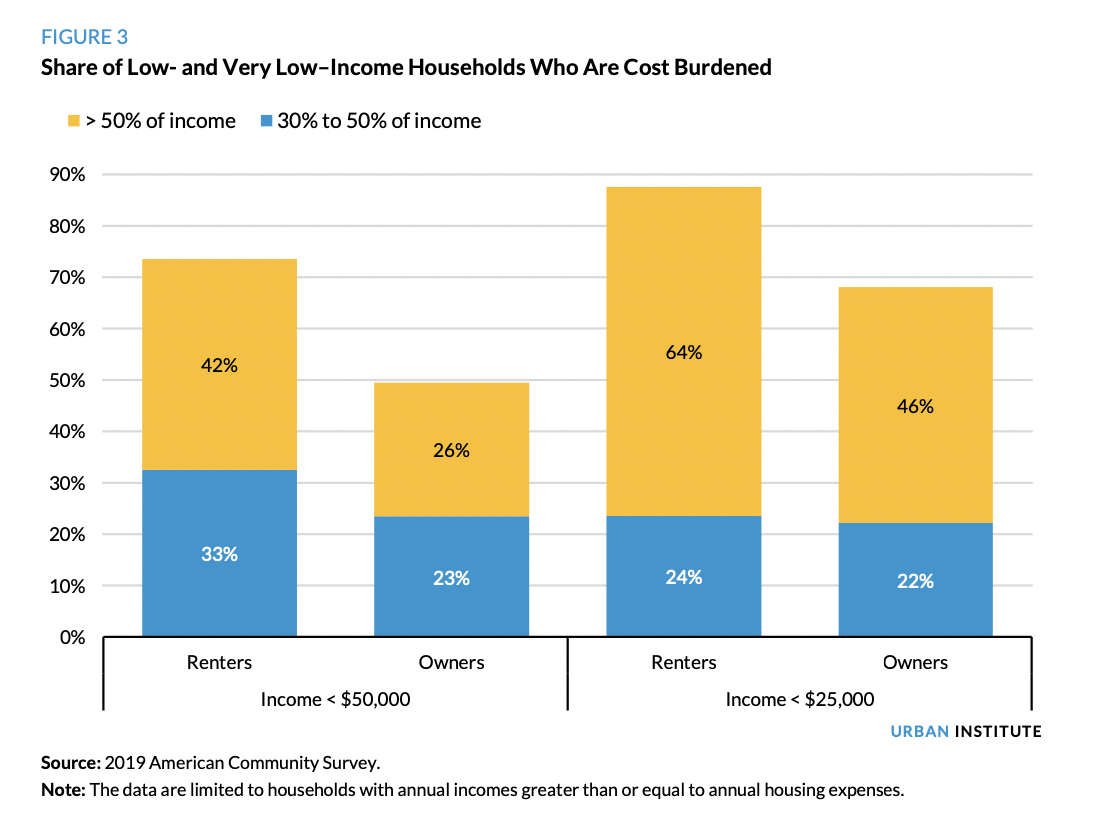
Today, about 47.6 million households have annual incomes below $50,000, which is less than 80 percent of the national median income and is the standard definition of “low income.” About half these households are renters and half are homeowners. And when it comes to housing costs among low- income households, the homeowners are better off (figure 3).
Of low-income renters, 75 percent are cost burdened, and 42 percent are severely cost burdened. In contrast, only 49 percent of homeowners in this income range spend more than 30 percent of their income on housing expenses, and only 26 percent spend more than 50 percent. The 26 percentage-point difference that separates cost-burdened renters from cost-burdened owners represents more than 6 million households and is a tremendous difference in how much money is available for other basic needs.
Notably, this trend continues the lower you go down the income ladder. The share of very low– income homeowners who are severely cost burdened is 18 percentage points less than the percentage of renters (46 percent versus 64 percent)
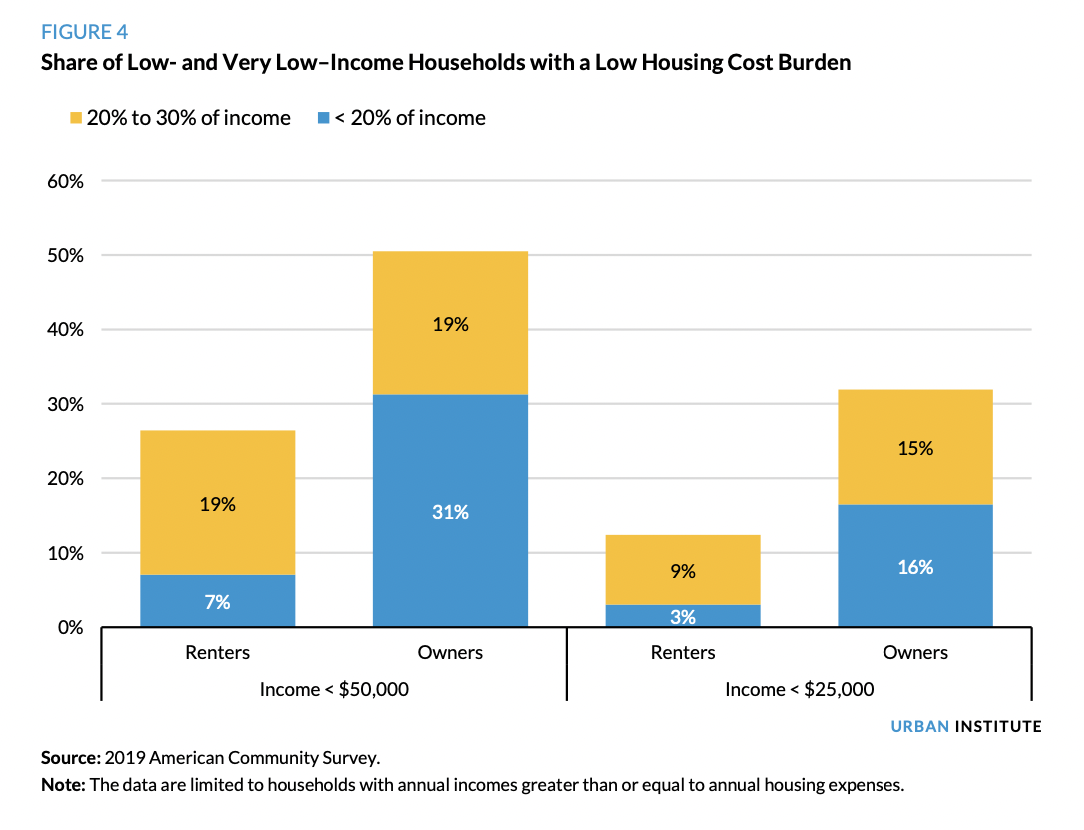
But the numbers get interesting when we look more closely at who is not cost burdened (figure 4). More than half of low-income homeowners are not cost burdened, compared with only 26 percent of low-income renters. And 31 percent of low-income homeowners enjoy a housing payment that is less than 20 percent of their income, a financial benefit only 7 percent of renters can claim. This nearly fivefold difference also holds true for very low–income households, with 16 percent of homeowners paying less than 20 percent of their income for housing versus only 3 percent of renters.
That said, many low-income homeowners are also cost burdened. Forty-nine percent of low-income and 68 percent of very low–income homeowners have a housing expense ratio that qualifies as cost burdened. Homeowners’ cost burdens tend to decline over time, both relative to income and in absolute terms, which is rarely true for renters. For homeowners, it gets better. I will explain this dynamic later. But first, let us turn to how buying a home is generally more affordable than renting, even on the date of purchase.
Source: 2019 American Community Survey.
On Day One, Buying a Home Is Often More Affordable Than Renting
Given how much more affordable homeownership is than renting, why do we usually assume renting is cheaper? I think it is because of how homeowners filter their experiences when they move from an apartment to a home they have purchased. Most homeowners’ monthly housing expenses increased when they purchased their first home. But the increase is often not caused by the shift from renting to owning. More often, it is caused by moving from a relatively small space—say, an apartment with one bedroom and one bathroom—to a large space, such as a three-bedroom, two-bathroom house with a yard and a garage. If we would have rented this home, rather than purchased it, our housing expense would have increased as well. And in most markets, renting that home would be more expensive than buying it. But because we typically improve our housing when we buy our first home, we do not notice that renting a comparable home might have been more expensive.
Another way to consider housing costs is by the sheer number of dollars that go out the door, first per month and then over the long term. In November 2020, the typical US home value was $263,351, according to the Zillow Home Value Index. Let us assume the homebuyer bought that typical home with a 30-year fixed-rate mortgage, that she did not make a down payment but instead financed the entire mortgage, that she paid the closing costs out of pocket, and that the interest rate is 3.5 percent, all of which are reasonable assumptions given where the market is at the time of publication.
Based on these assumptions, and using taxes and insurance cost estimates from the 2019 American Housing Survey, the buyer’s monthly mortgage payment is $1,464.7 In comparison, during that same time, the typical monthly rent was $1,734, according to the Zillow Observed Rent Index, meaning the renter is paying $270 more per month than the homebuyer.

Of course, these are national estimates, and housing costs can vary significantly in different markets. Nevertheless, the reduction in monthly payments owners experience versus renters is consistent across most of the country. It is more affordable to purchase a home than to rent a comparable one in 40 states, according to a geographic analysis of 2018 Zillow data.
A common objection to this kind of comparison is the argument that the homeowner is responsible for maintenance and property improvements, but for renters, these costs are borne by their landlord. This is a reasonable concern, and an accurate comparison must address it. According to the American Housing Survey, the typical homeowner spends about $167 per month on maintenance and home improvements. If we add this to our example, the buyer of the $263,351 home would still pay $93 less per month than the renter of comparable housing.
There are other complexities involved in comparing the costs of owning with the costs of renting that merit attention. For example, because renters tend to move more frequently than homeowners, they bear costs that are not accounted for in this analysis, including moving fees, security deposits, and repairs that a neglectful landlord may refuse to cover. Consequently, the real cost of renting is likely higher than Zillow’s typical monthly rent.
Additionally, some of the home improvement costs included in the American Housing Survey include improvements that may be optional, as opposed to critical, such as kitchen renovations and room additions. For this reason, the costs of necessary improvements used in this analysis are likely inflated. Moreover, some of these improvements may increase the home’s value so that the homeowner realizes a financial gain when they sell the home, an economic benefit of ownership that is potentially financially significant and is not accounted for in this example.
The Costs of Owning versus Renting over Time
The major affordability benefits of homeownership accrue overtime.
Rising rents and rising home prices do not affect renters and owners the same way. People commonly renew their lease each year, often accompanied by a rent increase designed to match or exceed inflation. There is no such thing as a 30-year residential lease that locks in a monthly payment. Between 2010 and 2020, rents annually increased an average of 3.19 percent. During the same period, the overall inflation rate was 1.73 percent.
Whereas renters are continuously vulnerable to cost increases, rising home prices do not affect homeowners. Nobody rebuys the same home every year. For the homeowner with a fixed-rate mortgage, monthly payments increase only if property taxes and property insurance costs increase. The principal and interest portion of the payment, the largest portion, is fixed. Meanwhile, the renter’s entire payment is subject to inflation.
Consequently, over time, the homeowner’s and renter’s differing trajectories produce starkly different economic outcomes. Homeownership’s major affordability benefit is that it stabilizes what is likely the homeowner’s biggest monthly expense, assuming a buyer has a fixed-rate mortgage, which most American homeowners do. The only portion of the homeowner’s housing expenses that can increase is taxes and insurance. The principal and interest portion stays the same for 30 years.
Assume a low-income household has an annual income of $40,000 and spends $1,200 each month on rent. The family decides that instead of continuing to put that $1,200 toward rent, they will use it to purchase a $205,000 home with the same monthly payment.
Figure 5 shows how a sample monthly rent payment increases over time compared with the monthly mortgage payment, both with and without estimated repair costs.11 By year 5, the rent payment is $139 more per month than the mortgage payment. By year 10, the rent payment has increased to $1,592 while the mortgage payment has increased to $1,248—a $343 difference.
By year 30, the difference between the monthly rent and mortgage payment has increased to $1,600 per month. When home repair costs are accounted for, the homeowner’s initial monthly expense is $167 more than rent. But the increased cost of owning disappears in year 7. And by year 10, the homeowner’s cost is $149 less than the renter’s, a trend that continues from there, with the homeowner’s savings increasing annually compared with the renter for the remainder of the mortgage loan.
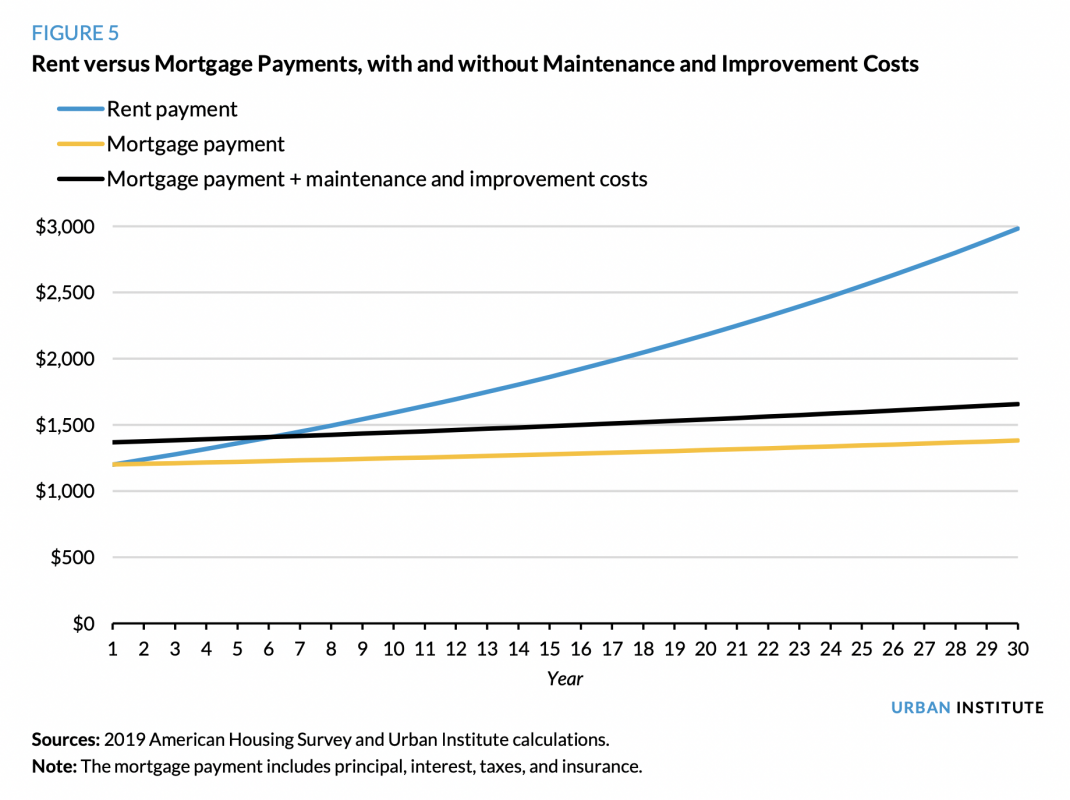
As this analysis makes clear, even if the renter’s monthly cost was initially lower than that of the homeowner, the renter’s savings would be short lived (assuming rental market inflation). Which begs the question of why we believe renting is cheaper than owning? Renting may be cheaper at first, especially if the rental unit is smaller and has fewer amenities than a home. But rents almost always increase disproportionately to the cost of owning, and it will not take long for ownership to be more affordable.
Why the Cost of Owning as a Share of Income Almost Always Declines Over Time
The above section compares how homeowners’ monthly payments increase at a much slower rate than renters’. But to more fully understand housing affordability, we need to understand how housing expense ratios behave over time. When we compare what happens to the housing expense ratios of owners and renters over time, the benefits of owning become even more pronounced. And we gain new insight into why many fewer low-income homeowners are cost burdened compared with their counterparts who rent.
In general, incomes, rents, and other expenses rise over time in some relationship to the overall inflation rate. If a renter’s wages and rent increase at the same rate, the share of one’s income spent on housing stays the same, as both the numerator and denominator increase in lockstep.
Rents Increase Faster Than Inflation
But incomes, rents, and other expenses do not typically rise at the same rate. Since 2010, the average annual nominal wage increase was 3.37 percent, while rents rose an average of 3.19 percent each year and the overall inflation rate was 1.73 percent.13 If rents increase faster than wages, the renter’s housing expense ratio increases. If wage increases outpace rent inflation, the renter’s housing expense ratio decreases.
But if the homeowner’s wages increase at the same rate as inflation, her housing expense ratio decreases because only her taxes, insurance, and home repair costs are subject to inflation. The biggest part of her housing expense, the principal and interest, is held constant. Even though both the renter’s and the homeowner’s costs increase with inflation, the homeowner’s costs increase less than the renter’s.
Annual increases in housing costs will always grow faster for renters than for homeowners.
Figure 6 illustrates this phenomenon using the same example as above: a household with an annual income of $40,000 and a $1,200 monthly housing payment. Both the renter and the homeowner have an initial housing expense ratio of 36 percent. When we account for estimated repair costs, the share of the homeowner’s income spent on housing is 41 percent. In this example, rent increases at the rent inflation rate of 3.19 percent, wages increase at 3.37 percent, and everything else (taxes, insurance, and repair costs) increases at the overall inflation rate of 1.73 percent (the average annual rates from 2010 to 2020).
Because wages increase slightly faster than rents, the renter’s housing expense ratio declines over time, but it takes 17 years to decline 1 percentage point, from 36 percent to 35 percent. It takes just one year for the homeownership housing expense ratio to drop 1 percentage point, and by year 17, it has declined to less than 23 percent. When estimated repair costs are included, the owner’s ratio is slightly lower than the renter’s by year 7. By year 17, the homeowner spends only 27 percent of her income on her mortgage payment and repairs, compared with the 35 percent of income the renter pays. By year 30, the renter spends 34 percent of her income on rent, while the homeowner’s mortgage payment takes up only 16 percent. With estimated repair costs, the ratio is still only 19 percent, 15 percentage points below the renter’s ratio.

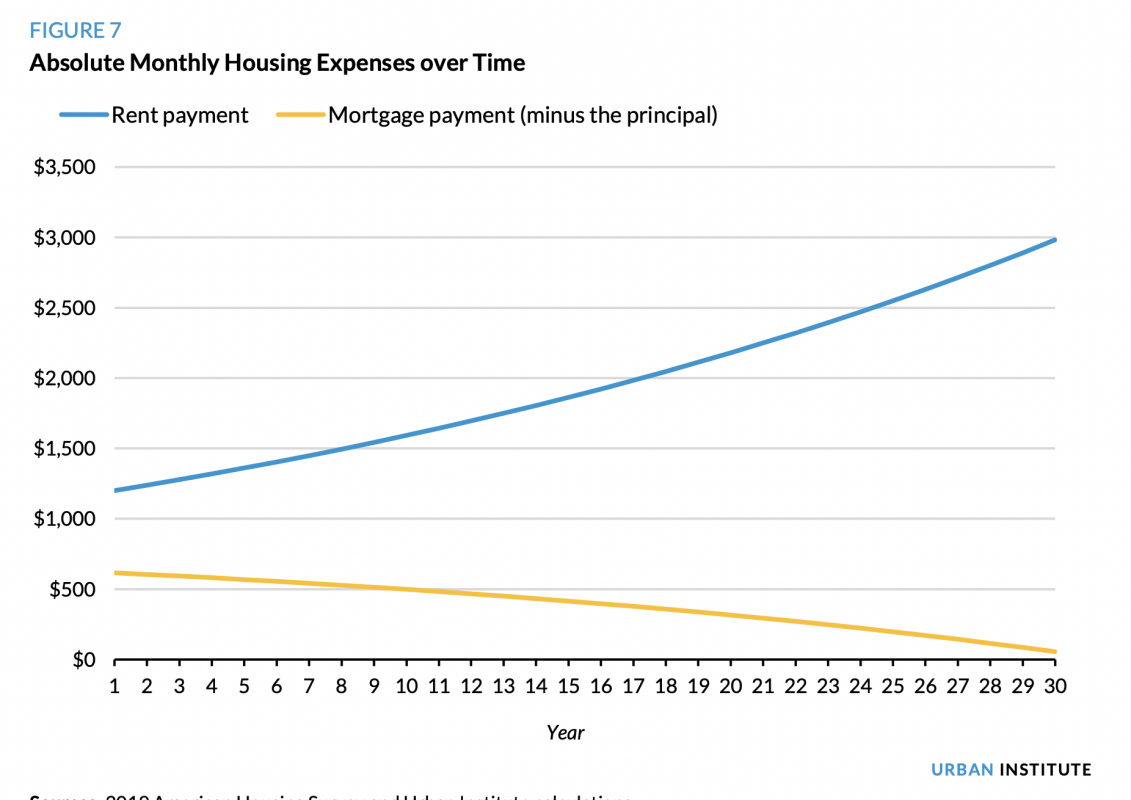
Homeowners’ Housing Expenses Decline over Time in Absolute Terms
Owning a home does not become more affordable only relative to income over time. It also becomes increasingly more affordable in absolute terms. The homeowner’s housing expenses decline over time because a portion of the mortgage payment is not an expense. Mortgage payments typically include principal, interest, taxes, and insurance, but only three of these elements are expenses. The principal portion that reduces the loan balance builds the homeowner’s equity. In doing so, the principal payments behave like an automatic savings account. The principal payment is not money going out; it is money staying in. As long as the home does not depreciate in value, the homeowner gets to keep the money. And it increases every month. As the homeowner pays down the mortgage balance, the portion of the payment dedicated to interest declines and the portion that goes to principal increases. Unless increases in taxes and insurance rise faster than the decreases in interest expense, the total mortgage payment decreases over time.
Put another way, the portion of the money the homebuyer spends on housing—the principal portion—is an investment in real estate. In comparison, cash spent on housing is always an expense for the renter. This is an important and frequently overlooked benefit of homeownership. Ownership capitalizes on the power of buying a home by converting a portion of what would otherwise be 100 percent consumer spending (renting) into a combination of consumer spending and investment. And it does so without additional resources. Buying a home is not a decision between investing in real estate versus investing in stocks, as financial advisers often claim. Instead, the home buying investment simply converts some portion of an existing expense (renting) into an investment in real estate.
The investment value of buying a home is not dependent on the home appreciating in value.
Even with 0 percent home appreciation, the automatic savings function of buying remains a big advantage. Assuming the home holds its value and does not depreciate, the buyer of a $205,000 home will have accumulated $21,121 in equity—or “invested” $21,121 in real estate—by year 5. By year 10, that nest egg more than doubles to $46,275. It more than doubles again by year 20 to $111,908 and reaches $205,000 in year 30. That’s $205,000 that is otherwise lost to the wind when renting.
But homes usually appreciate in value, an average of nearly 3.9 percent annually over the past 30 years, according to home price data from Black Knight. When accounting for home price appreciation, the homeowner’s investment can be significantly more than the value of the monthly principal payments. The same homeowner who accumulated $205,000 in equity from paying down mortgage principal would have $483,000 in total home wealth with a home appreciation rate of just 3 percent, half the historic rate. This helps explain why homeowners have more than 40 times the wealth renters have. And while Black and Hispanic homeowners have less wealth than white homeowners, Black owners have nearly 14 times the wealth of white renters and Hispanic owners have nearly 20 times, making clear the power of ownership to help shrink the racial wealth gap.
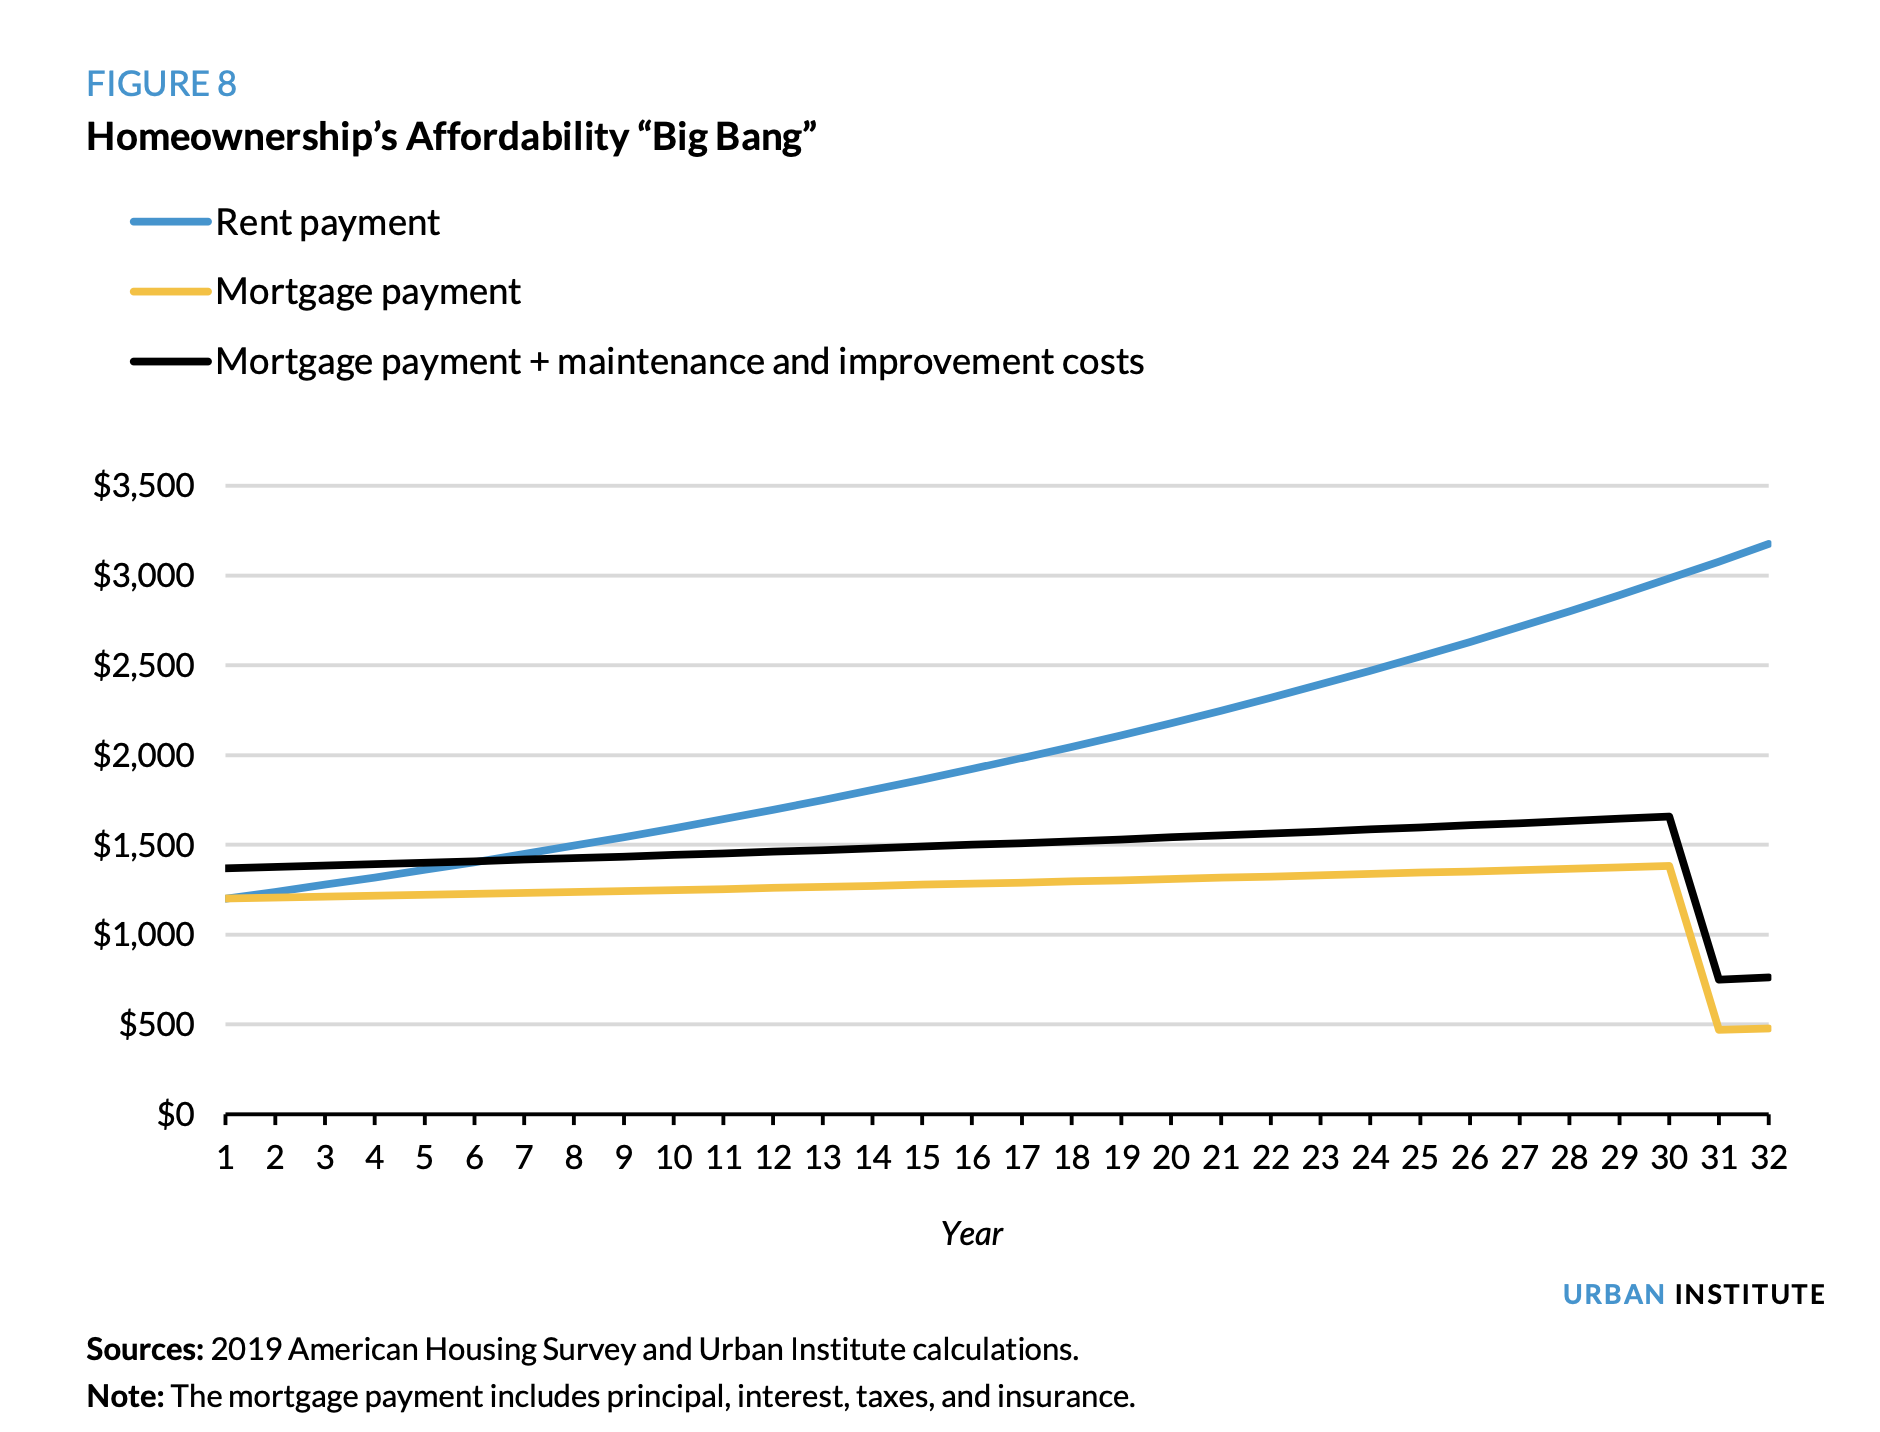
Homeownership’s Affordability Big Bang
The final meaningful financial benefit of homeownership is what I call the “affordability Big Bang.” After a homeowner household makes its final mortgage payment, its 361st payment drops tremendously because there is no longer a principal or interest portion. Instead, all the remains are the taxes and insurance (and any repair costs). This is homeownership’s affordability Big Bang.
Extending figure 7 to include year 31 (figure 8), the Big Bang becomes obvious. That year, the total mortgage payment drops to $470—or $749 including estimated repair costs—or 5 percent of household income, which increases to 8 percent when estimated repair costs are included. Meanwhile the renter’s payment for comparable housing has increased to more than $3,000, roughly 34 percent of household income.
It is true that the affordability Big Bang most significantly benefits homeowners who remain in the home for the life of the mortgage. But homeowners who sell or refinance their homes before the mortgage is fully paid off also benefit from an affordability Big Bang. Continuing with the example of a homeowner who bought a $205,000 property, suppose she sold it 10 years after she purchased it. Absent any appreciation, she would still have accumulated $46,275 in equity (her “automatic savings account”) from 10 years of principal payments. Assuming the closing costs she had to pay are 8 percent of the sales price, she would net about $30,000. And if the home appreciated at the modest rate of 3 percent annually, she would net more than $87,000.14 Regardless of the size of the affordability Big Bang, the homeowner receives a lump sum payment that can be used to offset the cost of her next housing choice, whether renting or buying.
Conveniently, the affordability Big Bang often has good timing, as the homeowner experiences declining housing expenses before retirement and its attendant declining income. My mom, now 91, still lives in her first and only home, the home I grew up in in Albuquerque. Although she struggled financially after she divorced and had to support three kids on her own, she was still able to retire at 62, largely because she locked in an affordable house payment early in her life. Over the course of her 30-year mortgage, her house payment increased only slightly, while her income slowly but steadily rose after her divorce in 1973. By the time she was 55, the affordability Big Bang kicked in, and her house payment dropped to just the cost of taxes and insurance. At 55, she began saving in earnest for retirement.
I do not want to under appreciate the importance of other aspects of our social safety net. They helped get my mom and our family to get through tough times and they are just as important today. But we should not underestimate the value of owning one’s own housing, gaining control over what is usually a person’s largest monthly expense, and significantly reducing that expense before retirement.
Conclusion
The most promising long-term solution to our country’s affordable housing crisis sits right under our noses. Most Americans live in homes they own. They pay, on average, 16 percent of their income for their home, far less than the 30 percent benchmark generally used to define an affordable housing payment. Yet when we think about affordable housing for families who are struggling, we do not think about how to help them own their homes. We instead think about building new subsidized apartment buildings or providing more rent vouchers. When it comes to affordable housing policy, the bias for rental solutions is so strong that policymakers almost always use “affordable housing” and “rental housing” interchangeably, as if they mean the same thing.
I want to be clear that I am not saying everyone should be a homeowner and that there is no need for rental housing, including subsidized rental housing. We need both, as well as other kinds of housing, which are essential to a healthy spectrum of housing that can serve the needs of all Americans. I am saying that we need to stop assuming that anyone below a certain income who rents is ineligible for ownership. We need to stop assuming that millions of low- and moderate-income workers are not “ready” for homeownership. We need to stop seeing housing as a reward for financial success and instead see it as a critical tool that can facilitate financial success. Affordable homeownership is not the capstone of economic well-being; it is the cornerstone. Once we accept that, we can begin to create the sorts of safe, affordable homeownership opportunities that can foster financial stability and mobility for millions of Americans.
Notes
- Data from the 2019 American Community Survey.
- “Owning a Home More Affordable Than Renting in Nearly Two Thirds of U.S. Housing Markets,” ATTOM Data Solutions, January 7, 2021, https://www.attomdata.com/news/market-trends/home-sales-prices/attom-data- solutions-2021-rental-affordability-report/.
- Data from USASpending.gov.
- Data from the 2019 American Community Survey.
- Data from the 2019 American Community Survey.
HOMEOWNERSHIP IS AFFORDABLE HOUSING 15
- Data from the 2019 American Community Survey.
- In this brief, “mortgage payment” refers to the total of principal, interest, taxes, and insurance.
- “The Cost of Renting vs. Buying a Home in Every State,” HowMuch.net, accessed April 21, 2021, https://howmuch.net/articles/cost-renting-vs-owning-home. Data from the Bureau of Labor Statistics.
- Assumesthebuyerfinances100percentofthepurchaseprice(payingclosingcostsoutofpocket)witha30-year mortgage at an interest rate of 3.5 percent and with the typical costs of property taxes and insurance according to the American Housing Survey.
- Assumesarentinflationrateof3.19percentandanoverallinflationrateof1.73percent,theaveragerates between 2010 and 2020.
- DatafromtheBureauofLaborStatistics.
- DatafromtheBureauofLaborStatistics.14 Assumesa30-yearfixed-ratemortgagewithaninterestrateof3.5percent,anannualappreciatiationrateof3 percent, and an 8 percent cost of sales when the home is resold.