
We expect that 2021 to be a strong year for real estate.
Here’s why:
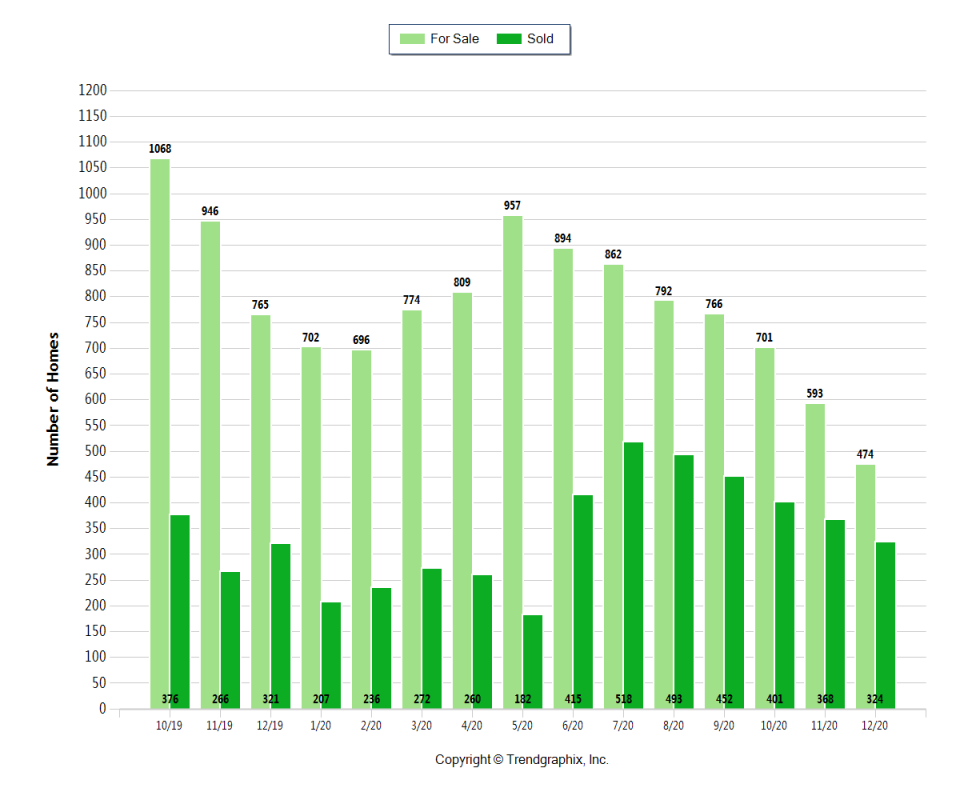
December 2020 was a seller’s market. The number of for-sale listings was down 38% from the previous year. The number of sold listings increased 0.9% year over year.
The average sold price-per-square-foot was up 18.8% year over year. Average days on market were down 45% and the ratio of sold price vs. the original list price is 96%.
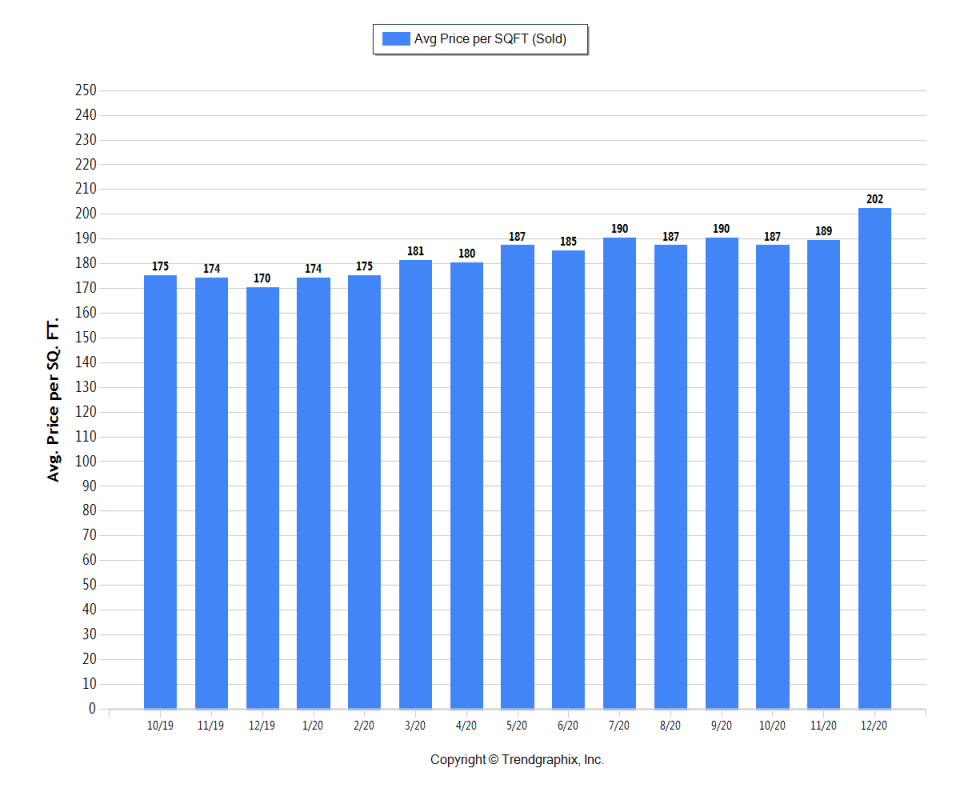
The average price per sq. ft. is a great indicator for the direction of property values. Sine median and average sold price are skewed by high and low properties, the average sold price per sq. ft. is a more normalized indicator on the direction of property values.
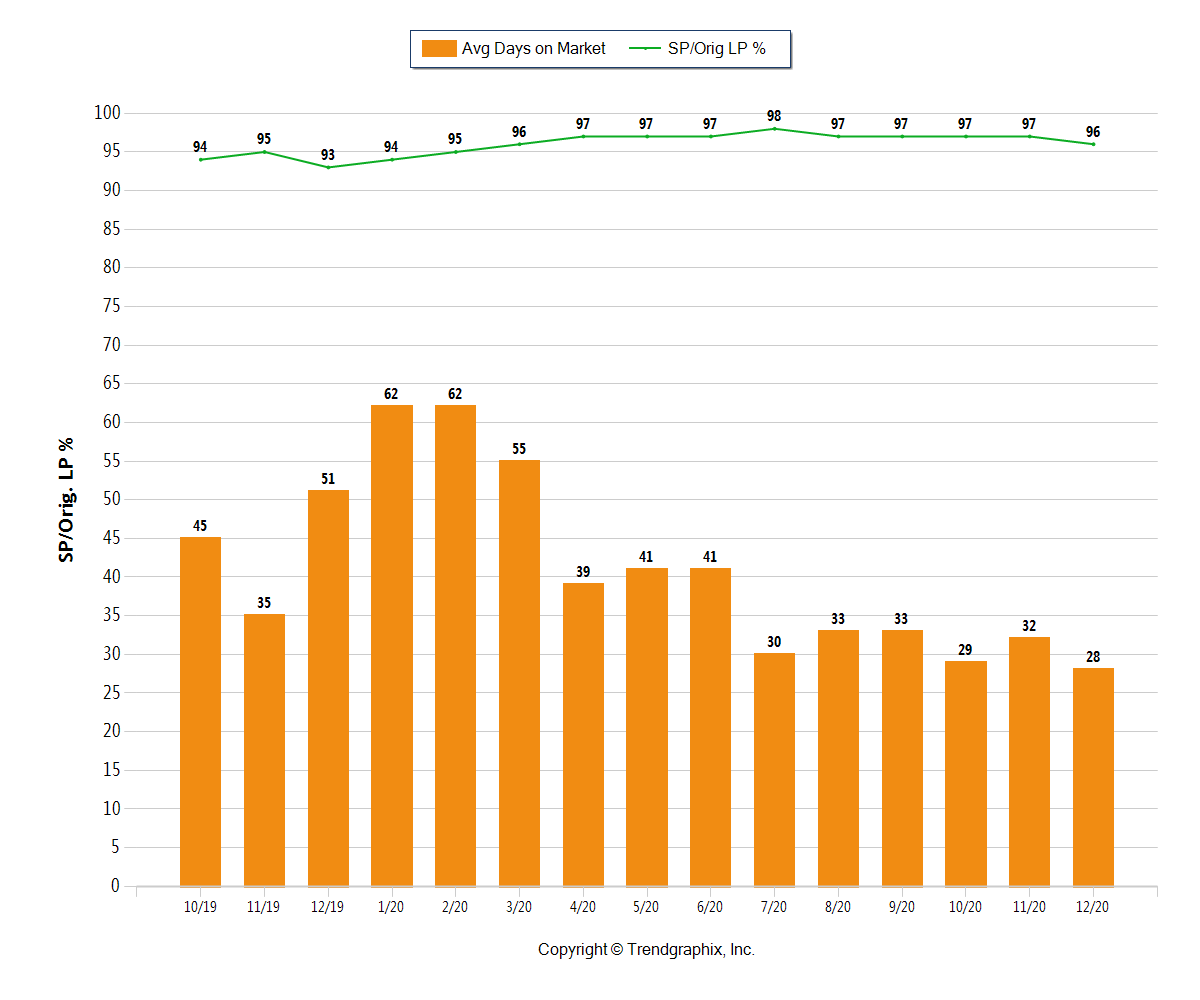
The average Days on Market (DOM) shows how many days the average property is on the market before it sells. A downward trend in DOM tends to indicate a move towards a seller’s market.
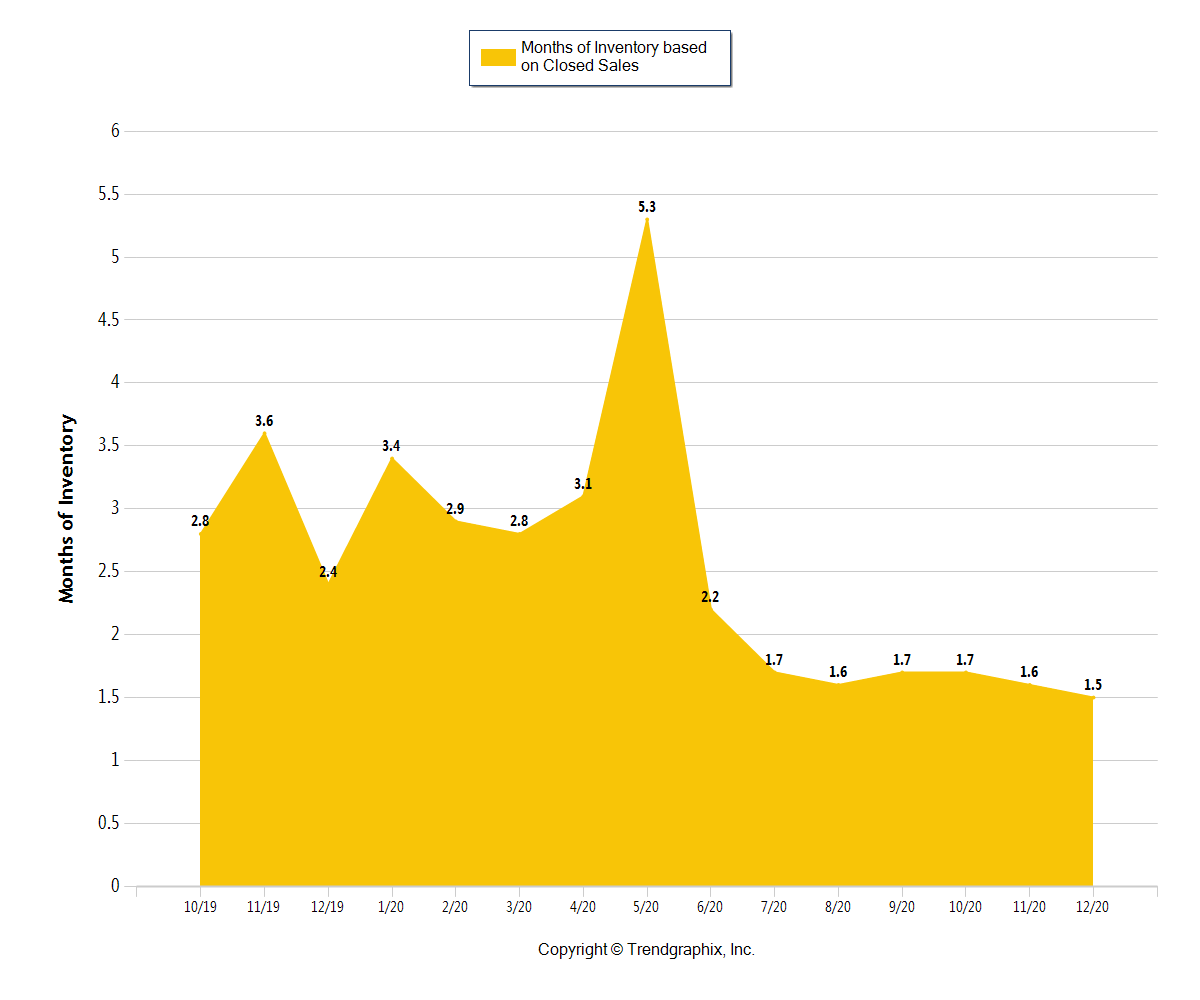
>6 months of inventory = a buyer’s market <6 months of inventory = a seller’s market. In December 2020, months of inventory based on closed sales was 1.5 indicating a continually strong seller’s market.
Andy’s Analysis:
Contact Us